Real Estate News in Brief
Mortgage rates always matter. But in this mixed-up, post-pandemic housing market, mortgage rates are the key to unlocking inventory AND affordability. Core inflation rates (CPI) continue to trend down; just not fast enough for the Fed. Meanwhile, home prices keep moving up as the modest inventory rebound has ground to a halt.
Headline CPI (Consumer Price Index = inflation) for July rose to 3.2%, from 3.0% in June. But core CPI (more closely watched by the Fed) dropped to 4.7% in July, from 4.9% in June. Both the headline and core figures were slightly lower than expectations (which is a good thing). [BLS]
Importantly, the YoY growth in shelter costs in CPI (rental rates + owners equivalent rent) continued to decline. July was the 4th-straight month that shelter inflation eased. The downtrend is now well-established and should last more than a year. [BLS]
More on that. The San Francisco branch of the Federal Reserve forecasts that “shelter” cost inflation (rental rates + owners equivalent rent) will drop below 5% by November 2023 and go negative around May 2024. Why is this important? Because the shelter component in CPI (35% weighting in headline CPI, 43% in “core”) has been?—?by far?—?the biggest driver of inflation over the last year. [San Francisco Federal Reserve]
Job growth slowed (but stayed solid). The US added 187,000 jobs in July and the June figure was revised down to 185,000. Both are the lowest figures seen since late-2019. That said, the unemployment rate was basically unchanged at the very low level of 3.5%. [BLS]
Black Knight’s Home Price Index rose 0.7% MoM in June, a new all-time high, with 30 of the 50 largest cities setting new price records. As a result of higher home prices, “tappable” home equity climbed to $10.5 trillion, within 4% of its 2022 peak. [Black Knight]
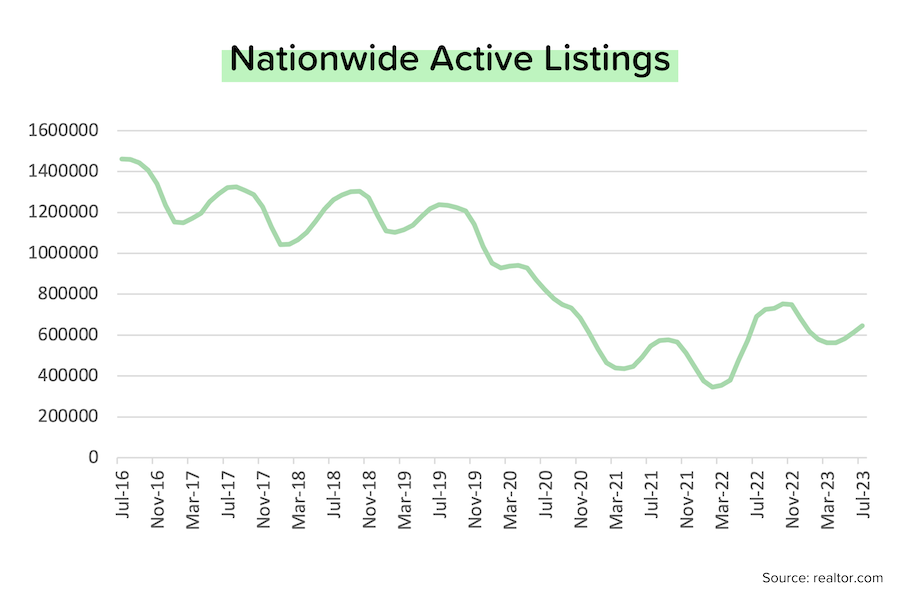
The mild inventory recovery that started in early 2022 has come to an end. In July 2023, active inventory (which excludes pending sales) fell 6% YoY to 647,000 units. That’s the first year-over-year decrease since April 2022. Compared to July 2019 (pre-COVID), active inventory is down 48%.
That said, the local supply picture is highly varied across the country. In some cities (like Austin TX), active inventory today is HIGHER than it was in July 2019. And in many cities (especially in the Midwest and Northeast), active inventory is down 60–80% compared to July 2019.
In the second quarter alone, US credit card balances grew by $45 billion pushing the total balance over $1 trillion for the first time in history. So while US consumers have been remarkable spenders during and after the pandemic, they’ve increasingly relied on plastic to fund their purchases?—?and the average interest rate on credit cards is around 22–23% [New York Federal Reserve]
Taking Inventory of the Situation
Inventory levels are seasonal: they typically begin rising in January/February as sellers list their homes in advance of the spring/summer selling season, and they typically peak in August/September and then decline throughout the fall and winter months.
Overall, the data for July was more negative (housing shortage intensifying) than positive. Nationwide active inventory rose 5% MoM to 647,000 units, but fell 6% YoY. That’s the first year-over-year decline since April 2022. The inventory rebuild that began in early 2022 has come to a halt?—?with active listings still 48% below their July 2019 (pre-COVID levels).
So what’s the problem? Demand is outstripping supply. Well-priced homes are selling very quickly (~75% of the homes sold monthly are on the market for less than a month). And new listings have disappointed (down ~20% compared to last year) as would-be sellers feel ‘locked-in’ by the low mortgage rates they got during the pandemic.
But keep in mind that your local supply/demand situation can be very different!
Many metros in the Midwest and Northeast had 70% fewer homes for sale in July 2023 than July 2019:
- Springfield, IL (-82%)
- Peoria, IL (-80%)
- Hartford, CT (-79%)
- Lebanon, NH (-79%)
- Trenton, NJ (-74%)
- Allentown, PA (-73%)
- Providence, RI (-71%)
In contrast, there are several metros where there are MORE homes for sale in July 2023 than in July 2019:
- Killeen, TX (+21%)
- Lubbock, TX (+17%)
- Kennewick, WA (+12%)
- Austin, TX (+6%)
- Huntsville, AL (+4%)
And many more metros where the inventory decline between 2019–2023 was less than 20%, for example:
- Nashville, TN (-16%)
- Memphis, TN (-16%)
- San Antonio, TX (-13%)
- Boise, ID (-13%)
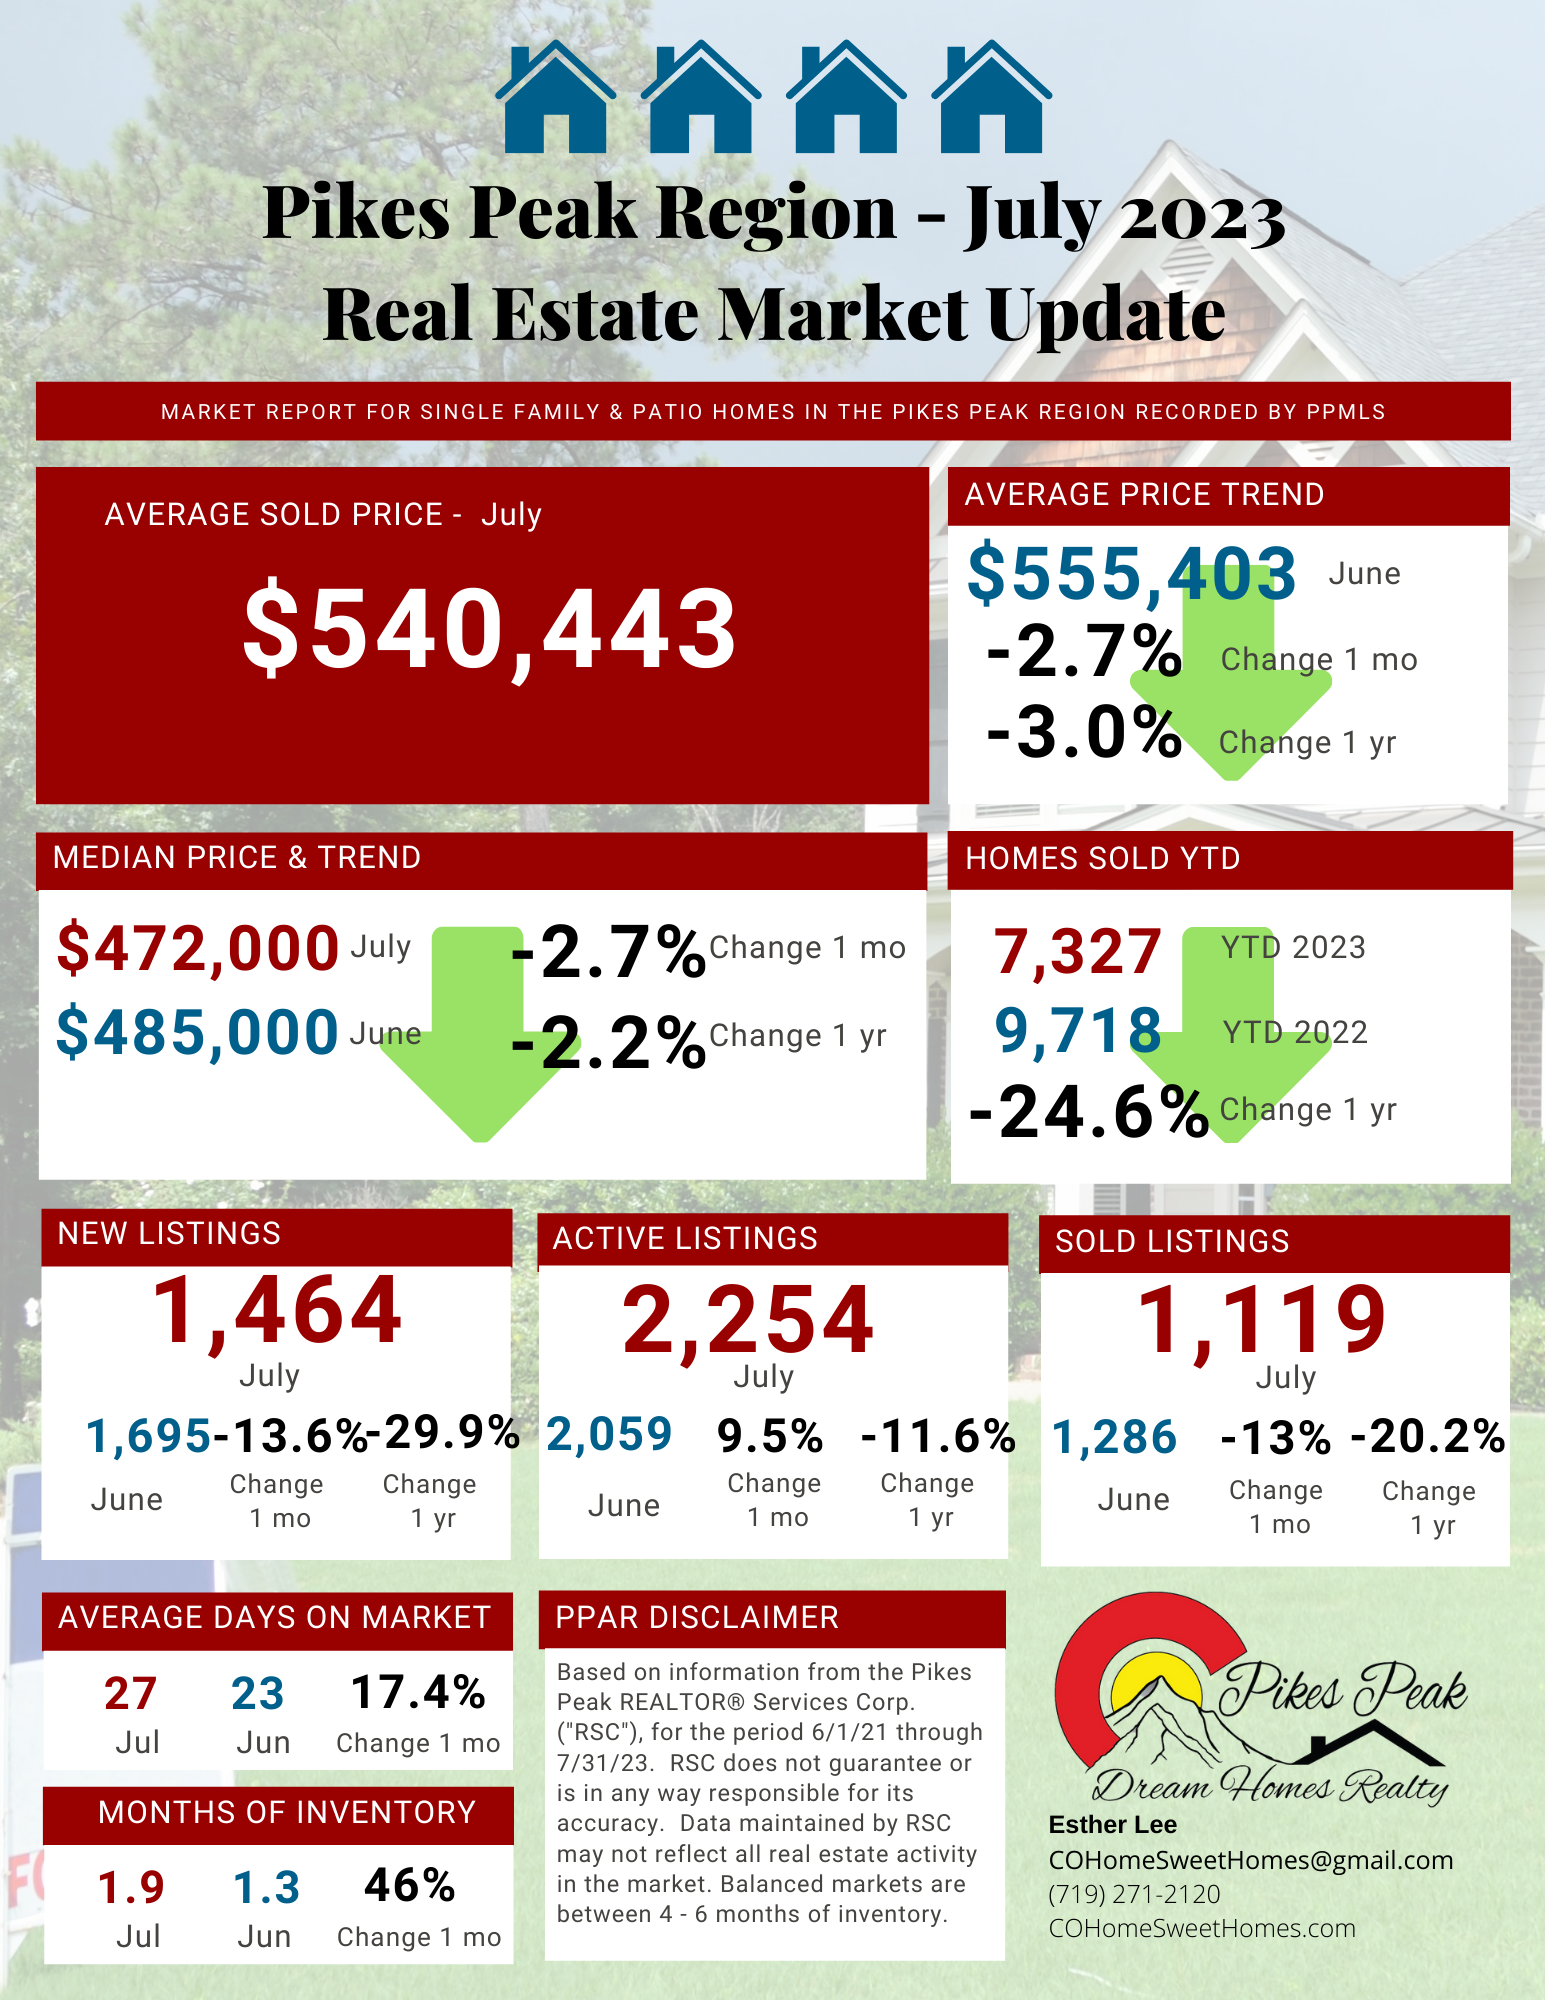
- Colorado Springs, CO (-11%)
- New Orleans, LA (-10%)
It should come as no surprise that the markets that are seeing the strongest upward pricing pressure are (for the most part) also the markets with the biggest decrease in inventory. And on the flip-side, the cities that have seen an increase in inventory (or a small decline), are the ones that have seen the biggest downward pricing pressure.
Keep in mind that this data only looks at the active inventory of existing homes. Cities like Austin, Boise and Memphis have also seen a huge increase in new construction, making the total inventory even higher.
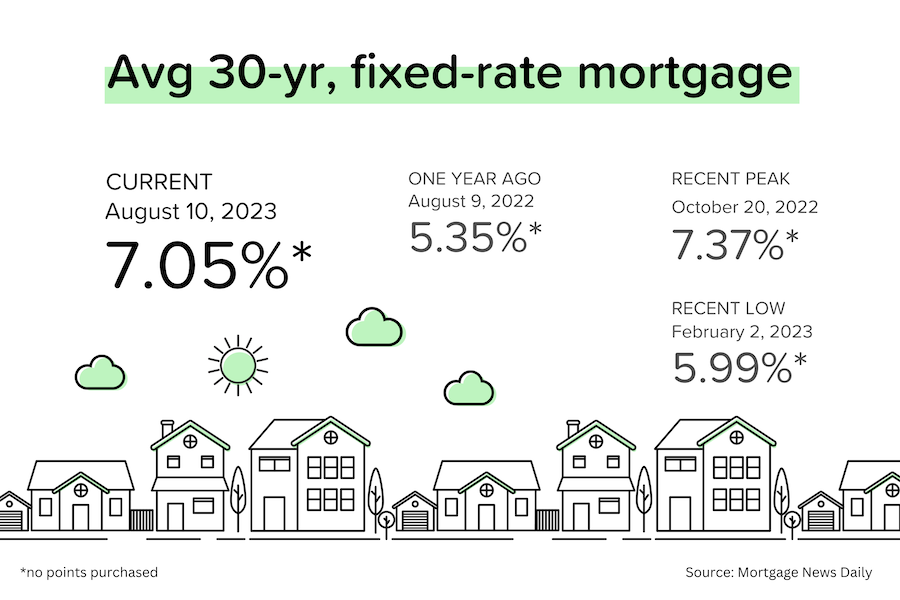
Mortgage Market
Mortgage rates always matter. But in today’s environment, they matter even more because they are dissuading both buyers and sellers from acting.
Inflation is absolutely, indisputably trending down. And the ongoing, significant decline in shelter costs will push overall CPI lower still, just as surely as the rise in shelter costs propelled it higher during 2021–2022.
But here’s the problem. While interest rates (and mortgage rates) will eventually follow inflation lower, they don’t always move in parallel. Many other factors can and do influence the yield on government bonds from week to week, such as credit rating downgrades, higher-for-longer commentary from Fed members, and announcements regarding the Treasury’s own massive issuance plans?—?all of which we got in the last few weeks.